Network Analyst is a geospatial tool based in networks used to support decisions. The networks are formed by edges (lines) and nodes (points).
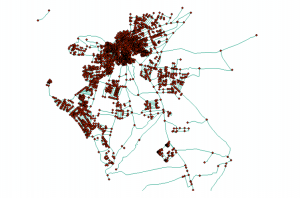
ArcGIS groups it in two categories:
Geometric Networks: The agent cannot choose the direction of travel as it depends on external forces like gravity or pressure (as in the case of water lines).
Network Dataset: The agent is free to choose the direction of travel (such as a vehicle).
- Creating a network dataset:
To be able to solve questions using ArcGIS such as closest facility, shortest route, optimum location, etc. we first need to create a network dataset.
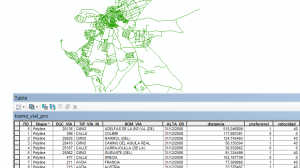
We need to generate a geodatabase and a feature dataset to organise it: New > File Geodatabase
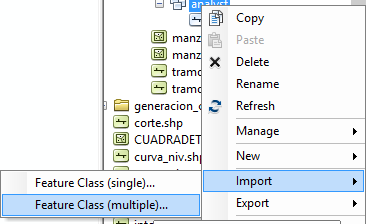
Then we add the layer inside by: Right Click > Import > Feature Class.
Right click on the feature imported and select “Network Dataset“.
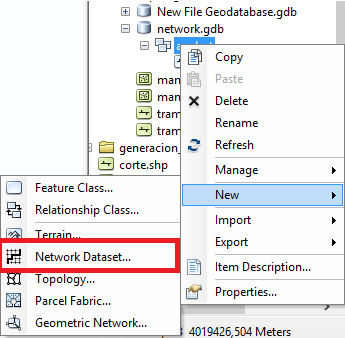
And now we start to set the Network Dataset parameters.
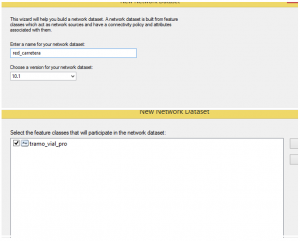
We first need to give it a name and then select the layers that will have an influence, for this case it will only be our polylines layer.
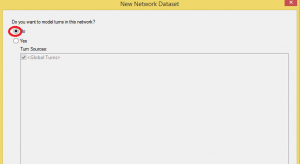
The next window refers to the option of adding forbidden turns.
To add them, we would need to have a generated layer representing them. As we don’t have it, we select “No”.
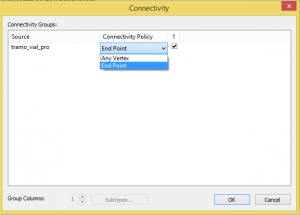
The next window is to decide where we want to include the Nodes (connecting junctions).
We define the connectivity of the network.

We will choose if the connecting junction appears at the beginning and end of each line or on any vertex.
We select “Any vertex”, to increase the mobility of the network.
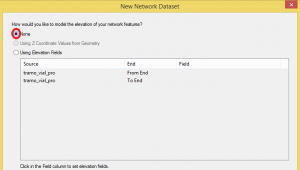
The following window refers to the elevation.
The option using Z-coordinate values from geometry means that if two lines share the same X,Y point, they will be connected but if it turns out that it is a bridge, they will not.
For this case we select the second option and we choose the attribute that defines the start and end of this line-bridge. As in our case it is a plain network, we choose the option “None”.
Next comes the most important part as we will add the attributes to generate the network.
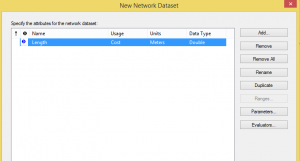
To add other attributes we select “Add ” so that we can choose the values.
For example: Descriptor means that the value does not depend on the length of the element (as for example speed).

Hierarchy is the order of preferences (preference given to the fastest roads in our case). We would have created an attributes field that depending on the type of route it will be under a hierarchy of 0 to 3 where 3 is the value with more preference.
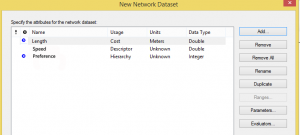
If some field doesn’t exist, an exclamation sign will appear next to it. Clicking it, we are able to create it.
For our case, we will generate the time to travel each route (as each speed is the maximum).
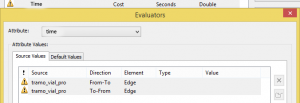
We say that the type is field, we click the operations table and select the operation as time is length/ speed.
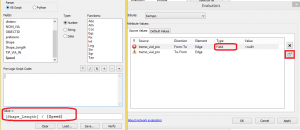
You will have to do this in both exclamations unless it is different for each travel direction.
Once accepted we convert the units to seconds.
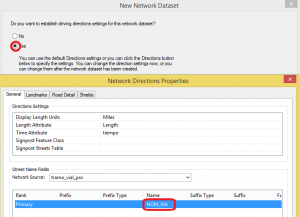
In the next window select if we want to obtain driving directions. We will say yes and also choose the option to obtain the name of the route.
Clicking Next, we will see a summary of all the settings and we select Accept to generate the dataset.
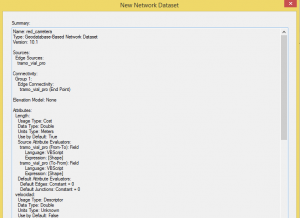
The dataset is now generated and we are ready to work with it.

Quality training taught by professionals
RECOMMENDED COURSE




Leave A Comment