One of the latest application launched by Google is Google Earth Engine, an advanced cloud-based geospatial processing platform, designed mainly for planetary-scale environmental data analysis. It combines a multi-petabyte catalog of satellite imagery and geospatial datasets, which allow users to visualize, manipulate, edit and create spatial data in an easy and fast way. It incorporates a wide range of spatial manipulation tools which allows scientists, researchers, and developers to detect changes, map trends, and quantify differences on the Earth’s surface.
The ability to analyze and manipulate data according to users needs, differentiate this application from the traditional Google Earth.
Earth Engine stores, more than thirty years of historical imagery and scientific datasets, updated and expanded daily. It organizes them and make them available for public users, as well as, for commercial ones or administrations systems.
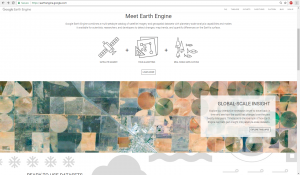
Other capabilities include:
- Integration with Python and JavaScript through its API. APIs for JavaScript and Python (hosted on GitHub) for making requests to the Earth Engine servers. These docs focus on JavaScript; (Get started guide for the Javascript API). For Python, see the Python install guide and the Python examples in the Earth Engine GitHub repository.
- Use our web-based code editor for fast, interactive algorithm development with instant access to petabytes of data. Code Editor: An online Integrated Development Environment (IDE) for rapid prototyping and visualization of complex spatial analyses using the Javascript API. Exlore the Code Editor docs.
To work with the application it is necessary to register as a user, for that you have to click on the “Sign up” button.
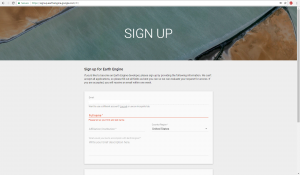
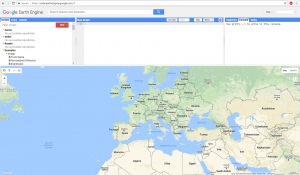
After your registration will be completed you can access the platform which and start exploring its capabilities. For example load different types of satellite images already processed.
Choose one of the “Scripts” that are already uploaded to the platform, for example, Normalized Difference, it will appear in the “New script” window and if you press the “Run” button the new image will be displayed in the viewer.
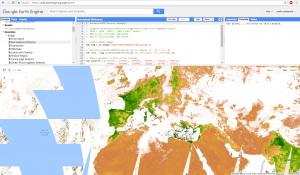
Using the GetLink button, the platform will generate a link that can be copied and accessed using another browser tab. This will offer the user a better interaction with the data just created improving the visualization of the data.
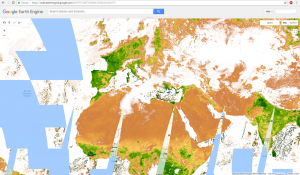
One of the best capabilities of this platform is that you can use different types of datasets. Among them you can find satellite, geophysical and weather images as well as demographic data, etc. You can even load and visualize both raster and vector data
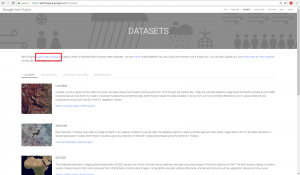
If you access the public data catalog, you can browse the data set of Google Earth Engine (Data Catalog) and you can show them in the Workspace:
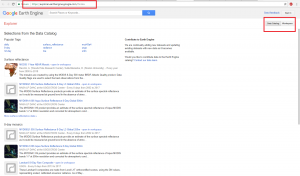
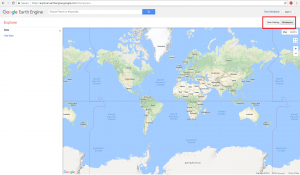
Here you can search and load different types of data types.
Use Add data option to load data. In this example we uploaded the SRTM data.
Use Add computation option to add and perform analysis on the data you just loaded. For this example we chose to display the Hillshade effect for the DEM data.
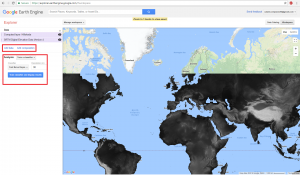
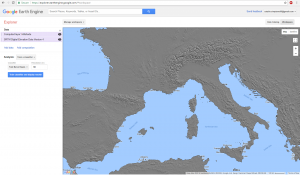
Once again, this type of tool demonstrate the utility of web development platforms, the easy integration of both, vector and raster data, as well as the possibilities to develop and run different types of algorithms and analysis. It also allows live interaction with processed data, which can be visualize in a dynamic cartographic viewer.
Check our Web development courses at the following link http://www.giscourse.com/web-development/ and chose what suits you the best.
Quality training taught by professionals
RECOMMENDED COURSE


It’s very important & helping in studying GIS and geospatial Data
Thanks Beatriz
I am interested in getting the google earth engine for my research work in Soil mapping at large scale for watershed management
Thank you for sharing this valuable platform functionality.
Adorei este web-site. a idéia é muitíssimo bom. Vou regressar outra hora.