Sinergise EO Browser is a free spatial data visualization tool which allows users to search and study a vast amount of satellite imagery. It brings together products like Sentinel-2 and Sentinel-3, ESA’s archive of Landsat 5, 7 and 8, global coverage of Landsat 8, and Proba-V. All of these can be found in the same place, providing a full resolution insight into more than 30 years of changes in Europe and several years worldwide.
EO Browser is an easy to use web application, publicly available with no registration needed to access standard functions. It combines many remarkable features such as comparison of data to easily identify changes, various visualization options (true color, false color, NDVI, etc.), custom band combinations and even some data processing mechanisms, allowing users to run classification scripts.
Let’s see what we can do with this web tool.
1 – VIZUALIZATION OF DATA
- Go to https://apps.sentinel-hub.com/eo-browser/, a web GIS interface will open. Here you can search, visualize, pin and perform comparations between series of data.
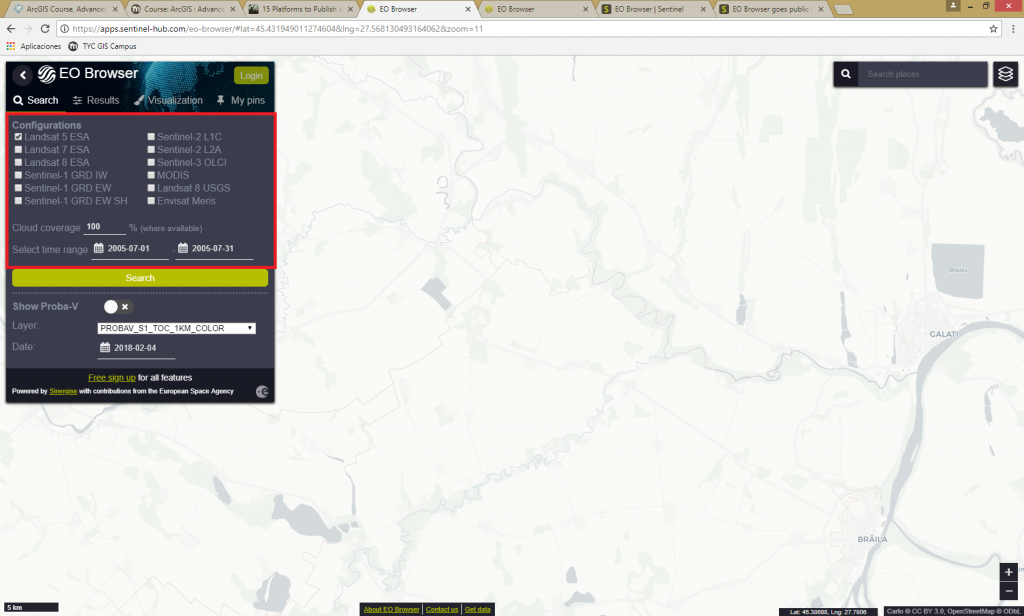
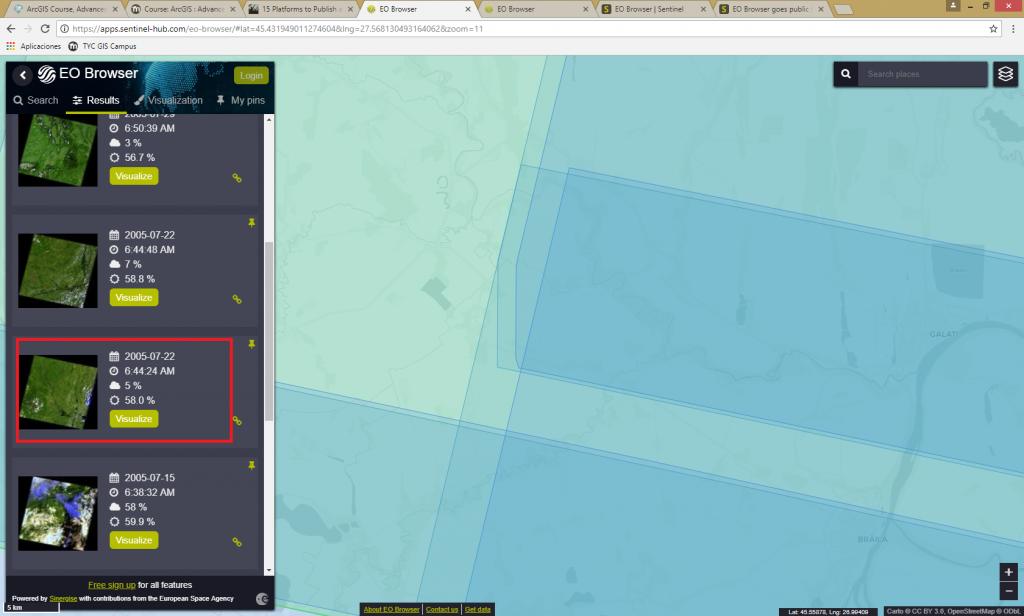
- In the Results tab you can navigate through your search results and select the suitable data for you. Click Visualize.
- The Visualisation tab will allow you to view your selected data.
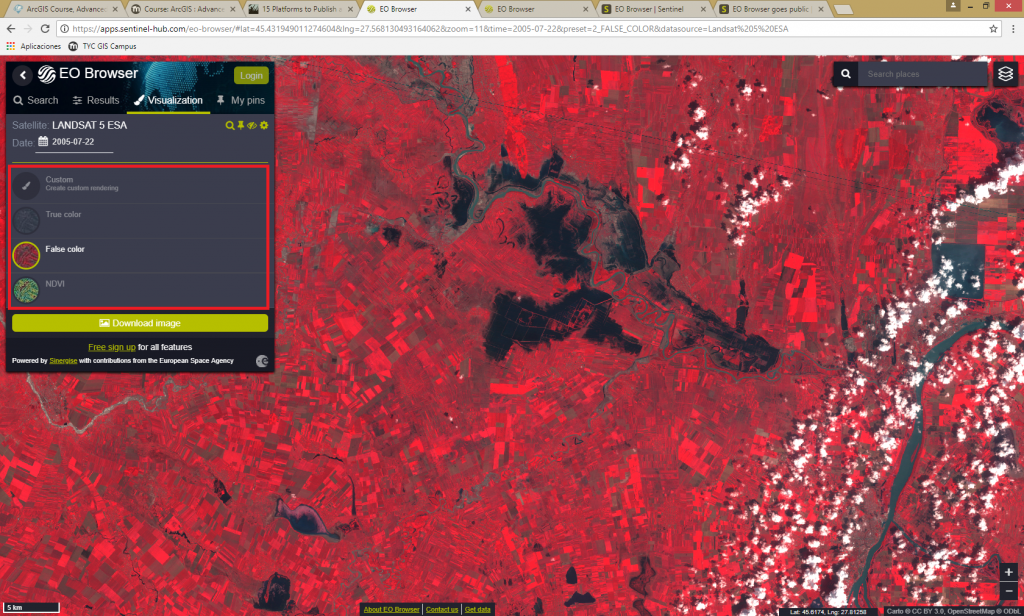
- In the Visualisation tab you have few option of how the data will be displayed: true color, false color, NDVI, or Costum band combination. Select the false color option, the result should be like in the image above. We can observe that the image above displays a flood from 22 July 2005. The location of the area is South East part of Romania where Siret River meets Danube River.
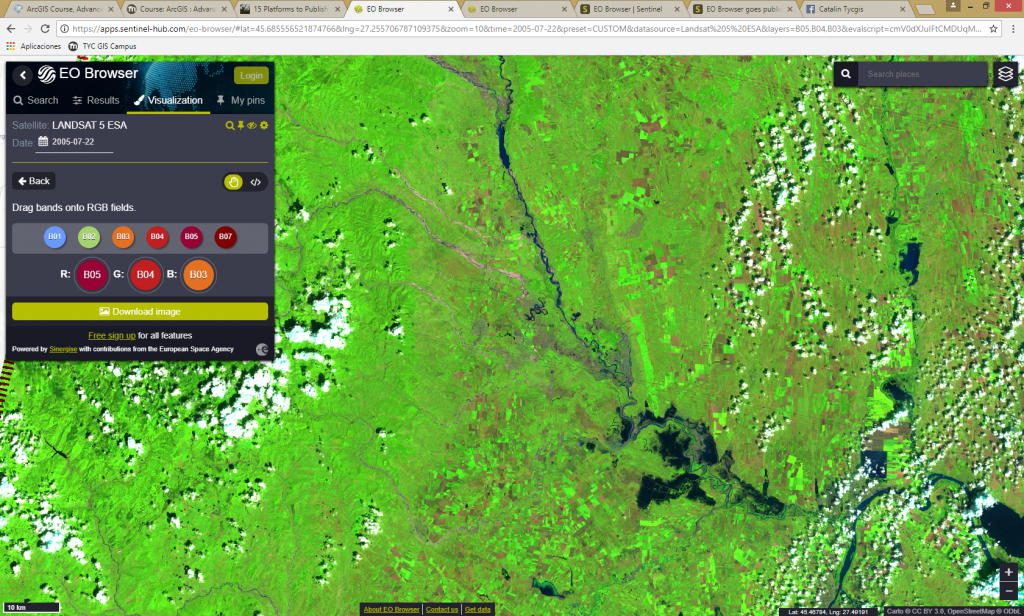
- Next go to Costum band combination and select a combination in order to underline the water areas, for example chose 543 or 542.
2 – DATA COMPARATION
- Now after we identified an area where a natural hazard took place lets make a comparative analysis between two sets of data and see the differences between them. Before and after the hazard took place.
- Do not forget to Pin the image before performing any operations.
- Now go back to Search tab and search for an Landsat image of the same area acquired before 22 July 2005. Go to Custom and chose the same band combination.
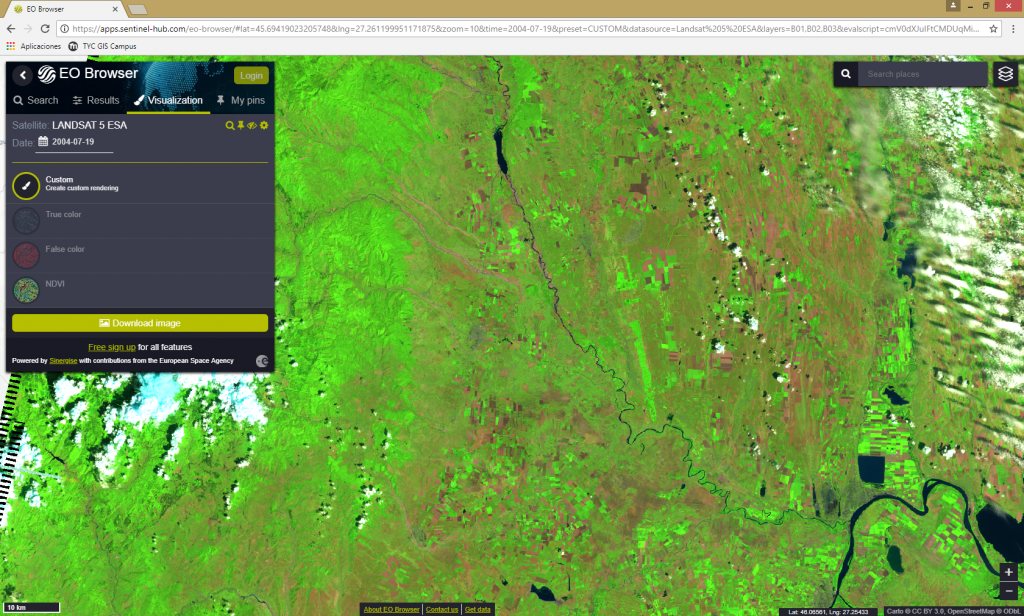
- Pin this extend and image also.
- In order to realize the comparative analysis between these two scenes go to My pins and click on Compare.
- Apparently the application do not allow the comparative analysis between two image composites. Go back and set as pinned images the default false color of both scenes. After that you can start the comparation.

Quality training taught by professionals
RECOMMENDED COURSE



please help me about how can download or register the Eo broser tool
isit possible download the app
This application is a web tool, you do not need to download it or register. Just follow the steps in this tutorial. Thank you!
Hi
The link you provided doesn’t appear to be working. However, this one does: https://apps.sentinel-hub.com/sentinel-playground/
Thank you for the interesting article!
Kind regards,
Olav Stenerud
Hi Olav, Actually is this link https://apps.sentinel-hub.com/eo-browser/.
Thank you for your feedback.
We appreciate.