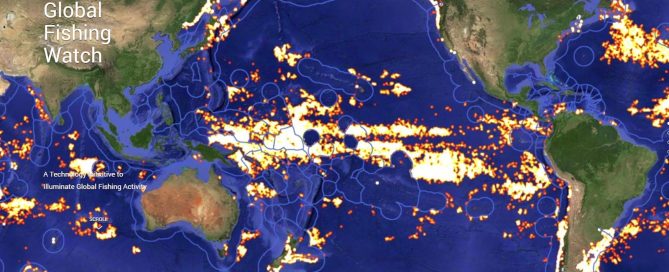
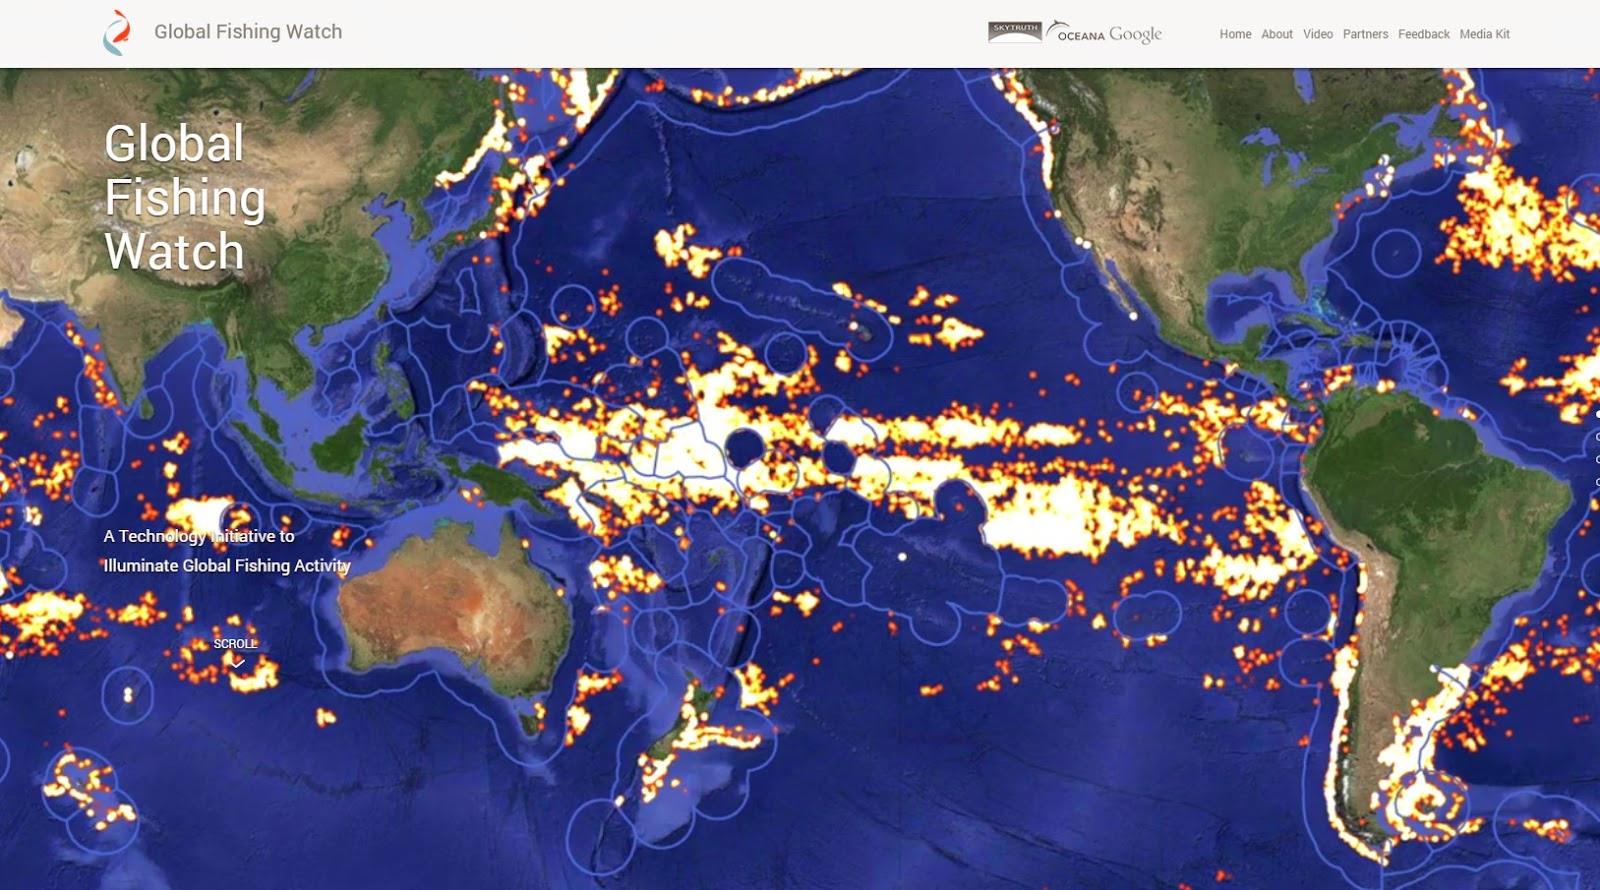
GIS informs you about overfishing and fishing activity in the ocean

Once again, Geographic information demonstrates its large applications for great initiatives as the one seen in the Global Fishing Watch: a tool to observe fishing fleet activity around the world. […]

By |2017-10-26T13:41:12+00:00March 12th, 2015|BLOG|0 Comments

Grizzly bear population density in the Yellowstone National Park (U.S)

The Grizzly bear (Ursus arctos ssp.) is a subspecies of the brown bear, mainly located in Canada and the United States. Being a main priority in conservation, let´s read more to learn how arcGIS can help us measure protection efforts applied to wildflife species. […]

By |2017-10-26T13:21:09+00:00March 6th, 2015|BLOG|0 Comments

Become an Environmental ArcGIS specialist

Geographic Information Systems have turned out to be a potential tool for the support in decision making inside environmental projects. The course starts from the very beginning; helping consolidate basic knowledge to work with geolocation information, such as a correct definition of the coordinates system and the editing and generation of new information. […]

By |2017-10-26T13:00:50+00:00March 4th, 2015|BLOG|0 Comments

Download free layers in vector format (shape *.shp) from all the world countries!

The European Statistics Office,EUROSTAT, offers totally free digital cartography of the world in general – and Europe in particular – in vector format (layers in shapefile format)! […]

By |2017-10-26T11:31:44+00:00February 27th, 2015|BLOG|1 Comment

How to calculate true distance over a surface using ArcGIS

It is quite probable that for some of our analysis we will need to include the distance between two given points, measured in a straight line. We will need to value if we need to take into account the topography of the study area to calculate this data. If this is so, we can easily do [...]

By |2017-10-26T10:58:20+00:00February 18th, 2015|BLOG|0 Comments

How to create a point vector layer from X, Y coordinates using ArcGIS

In this short tutorial we will show you how to create a vector point layer using coordinates data, stored in an excel sheet. We are going to map the museums located in the central part of Madrid (Spain). […]

By |2017-10-26T11:09:28+00:00February 12th, 2015|BLOG|0 Comments

Title

Go to Top