Today we are going to study the erosion risk of a terrain. With multicriterial analysis we are going to analyse the slope as well as its proximity to rivers.

We will follow these 3 steps:
- Analyse the slopes of the terrain
- Analyse the proximity to rivers
- Carry out the multicriteria analysis
1. Analyse the slopes of the terrain
We need a DTM raster layer.
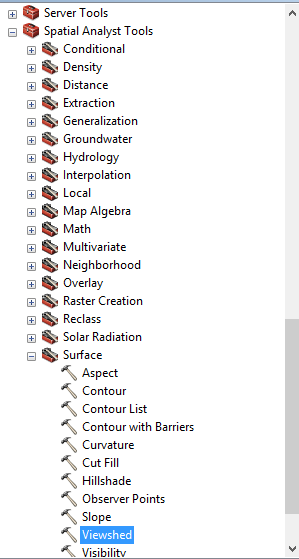
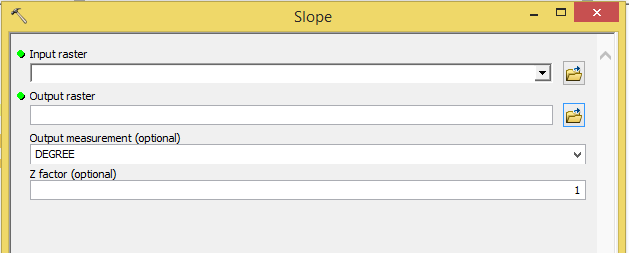
First of all we are going to use the Slope tool: Spatial Analyst Tools > Surface > Slope.
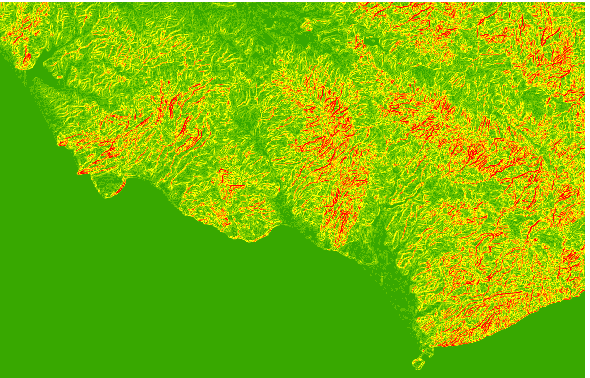
Now, the problem is that we have data in a different scale.
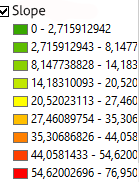
Therefore we will reclassify it in 4 degrees according to its gradient, being the highest number the one of biggest inclination: Spatial Analyst Tools > Reclass > Reclassify.
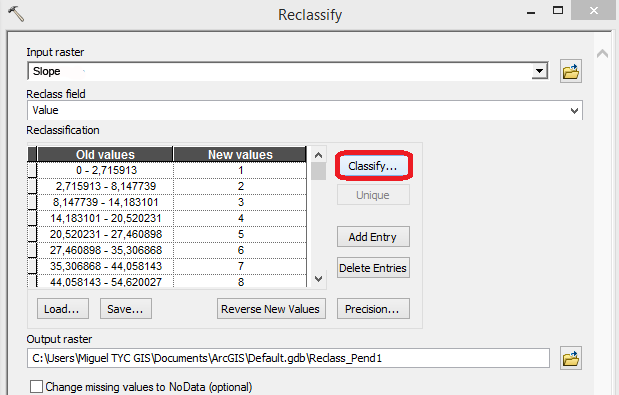
First, click Classify in order to fix the classes and define the break values.
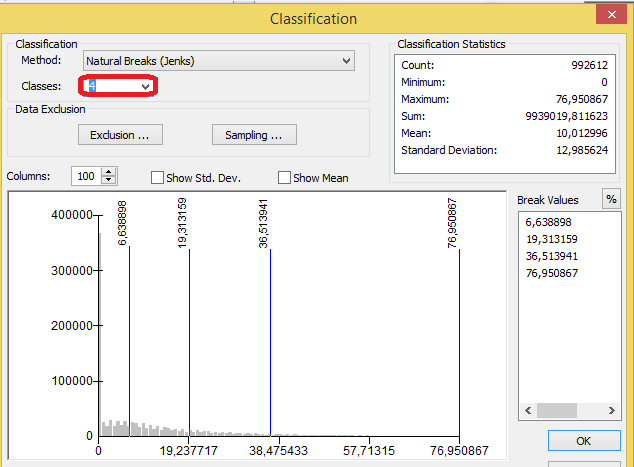
Click OK and you return to the previous window where we will value the areas with highest inclination with a bigger number.
2. Analyse the proximity to rivers
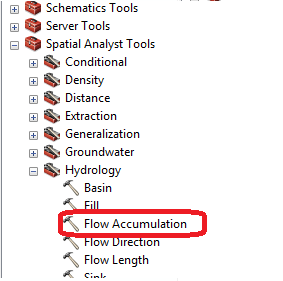
We need to obtain the river basins. To do so, lets go to: Spatial Analyst Tools > Hidrology > Flow accumulation.
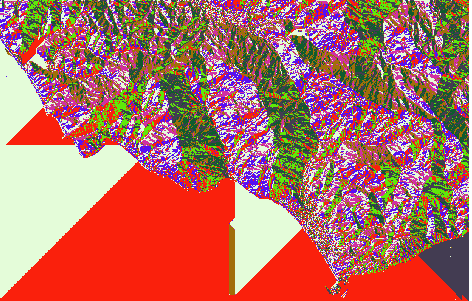
Next, with the generated raster we select:
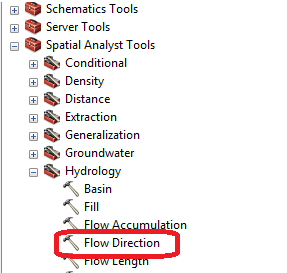
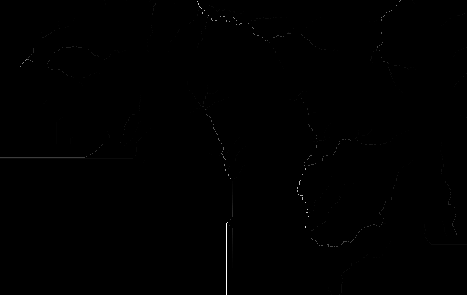
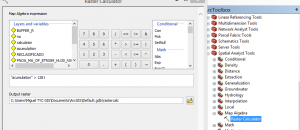
TRICK: Going back to classify inside reclassify, we can observe the graphic and find the accumulation value of the river. We will use the raster calculator to determine that it select those values bigger than the accumulation value.
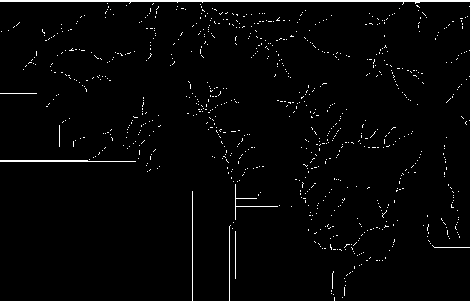
Spatial Analyst Tools > Hydrology > Stream to Order.
In the first window we choose the raster that we just generated and in the second one the resulting “flow direction”.
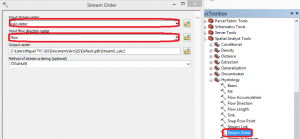
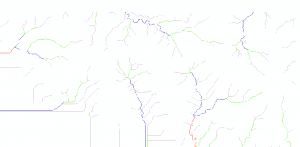
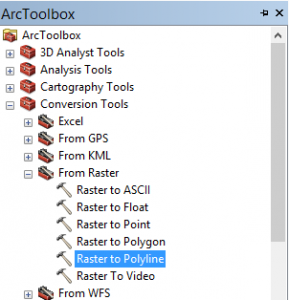
We transform this to polyline, do a 300m buffer and return to raster:
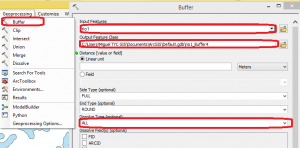
Add the line layer that we just obtained, select 300m (to obtain the area surrounding 300m of the whole polyline) and select Dissolve all.
We will finally generate a raster.
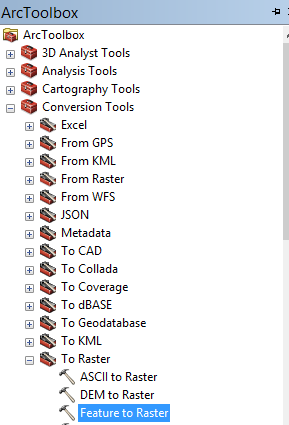
3. Carry out the multicriteria analysis.
We will now reclassify the buffer raster in such a way that it has value 4 (as the whole raster will have value 0, we will give it a high value for the future sum).
With the raster calculator we sum the reclassified slope and the reclassified buffer.
The areas of value 8 are the most dangerous ones. The risk will decrease as you move down the scale value.
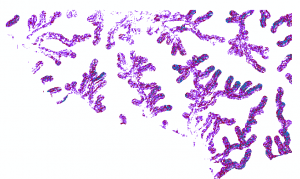
Overlaying the raster to the shaded DTM we can observe in detail the most susceptible risk areas.

Quality training taught by professionals
RECOMMENDED COURSE




can someone tell me how do i classify the raster buffer in a way that it has 4 value? and which are the area of value 8? thanks
Good approach for a large area analysis. Can this applied to small scale area
Hello! I think for small scales you should have high resolution data available. In this way it should work.
Thank you!